Experimental Design
Experimental design ensures reliable and unbiased results by structuring studies to isolate treatment effects and control variability. This section covers three key designs—completely randomized, randomized block, and matched pairs.
Types of Designs
What is a Completely Randomized Design?
A completely randomized design assigns treatments to subjects entirely at random, without grouping or blocking. This design works well when the subjects are similar and there are no additional variables that need to be controlled.
Example: A clinical trial randomly assigns participants to receive one of three medications to treat high blood pressure. Results are compared across all participants.
Example
Many utility companies have introduced programs to encourage energy conservation among their customers. A particular company has three options:
- Place a small digital display in households to show current electricity usage.
- Give customers a chart and information about monitoring their use from the outside meter.
- Use a control group that receives general information about conserving energy but no tools to monitor their use.
Design a flowchart that models this experiment.
Solution
The experiment can be modeled using a completely randomized design as follows.
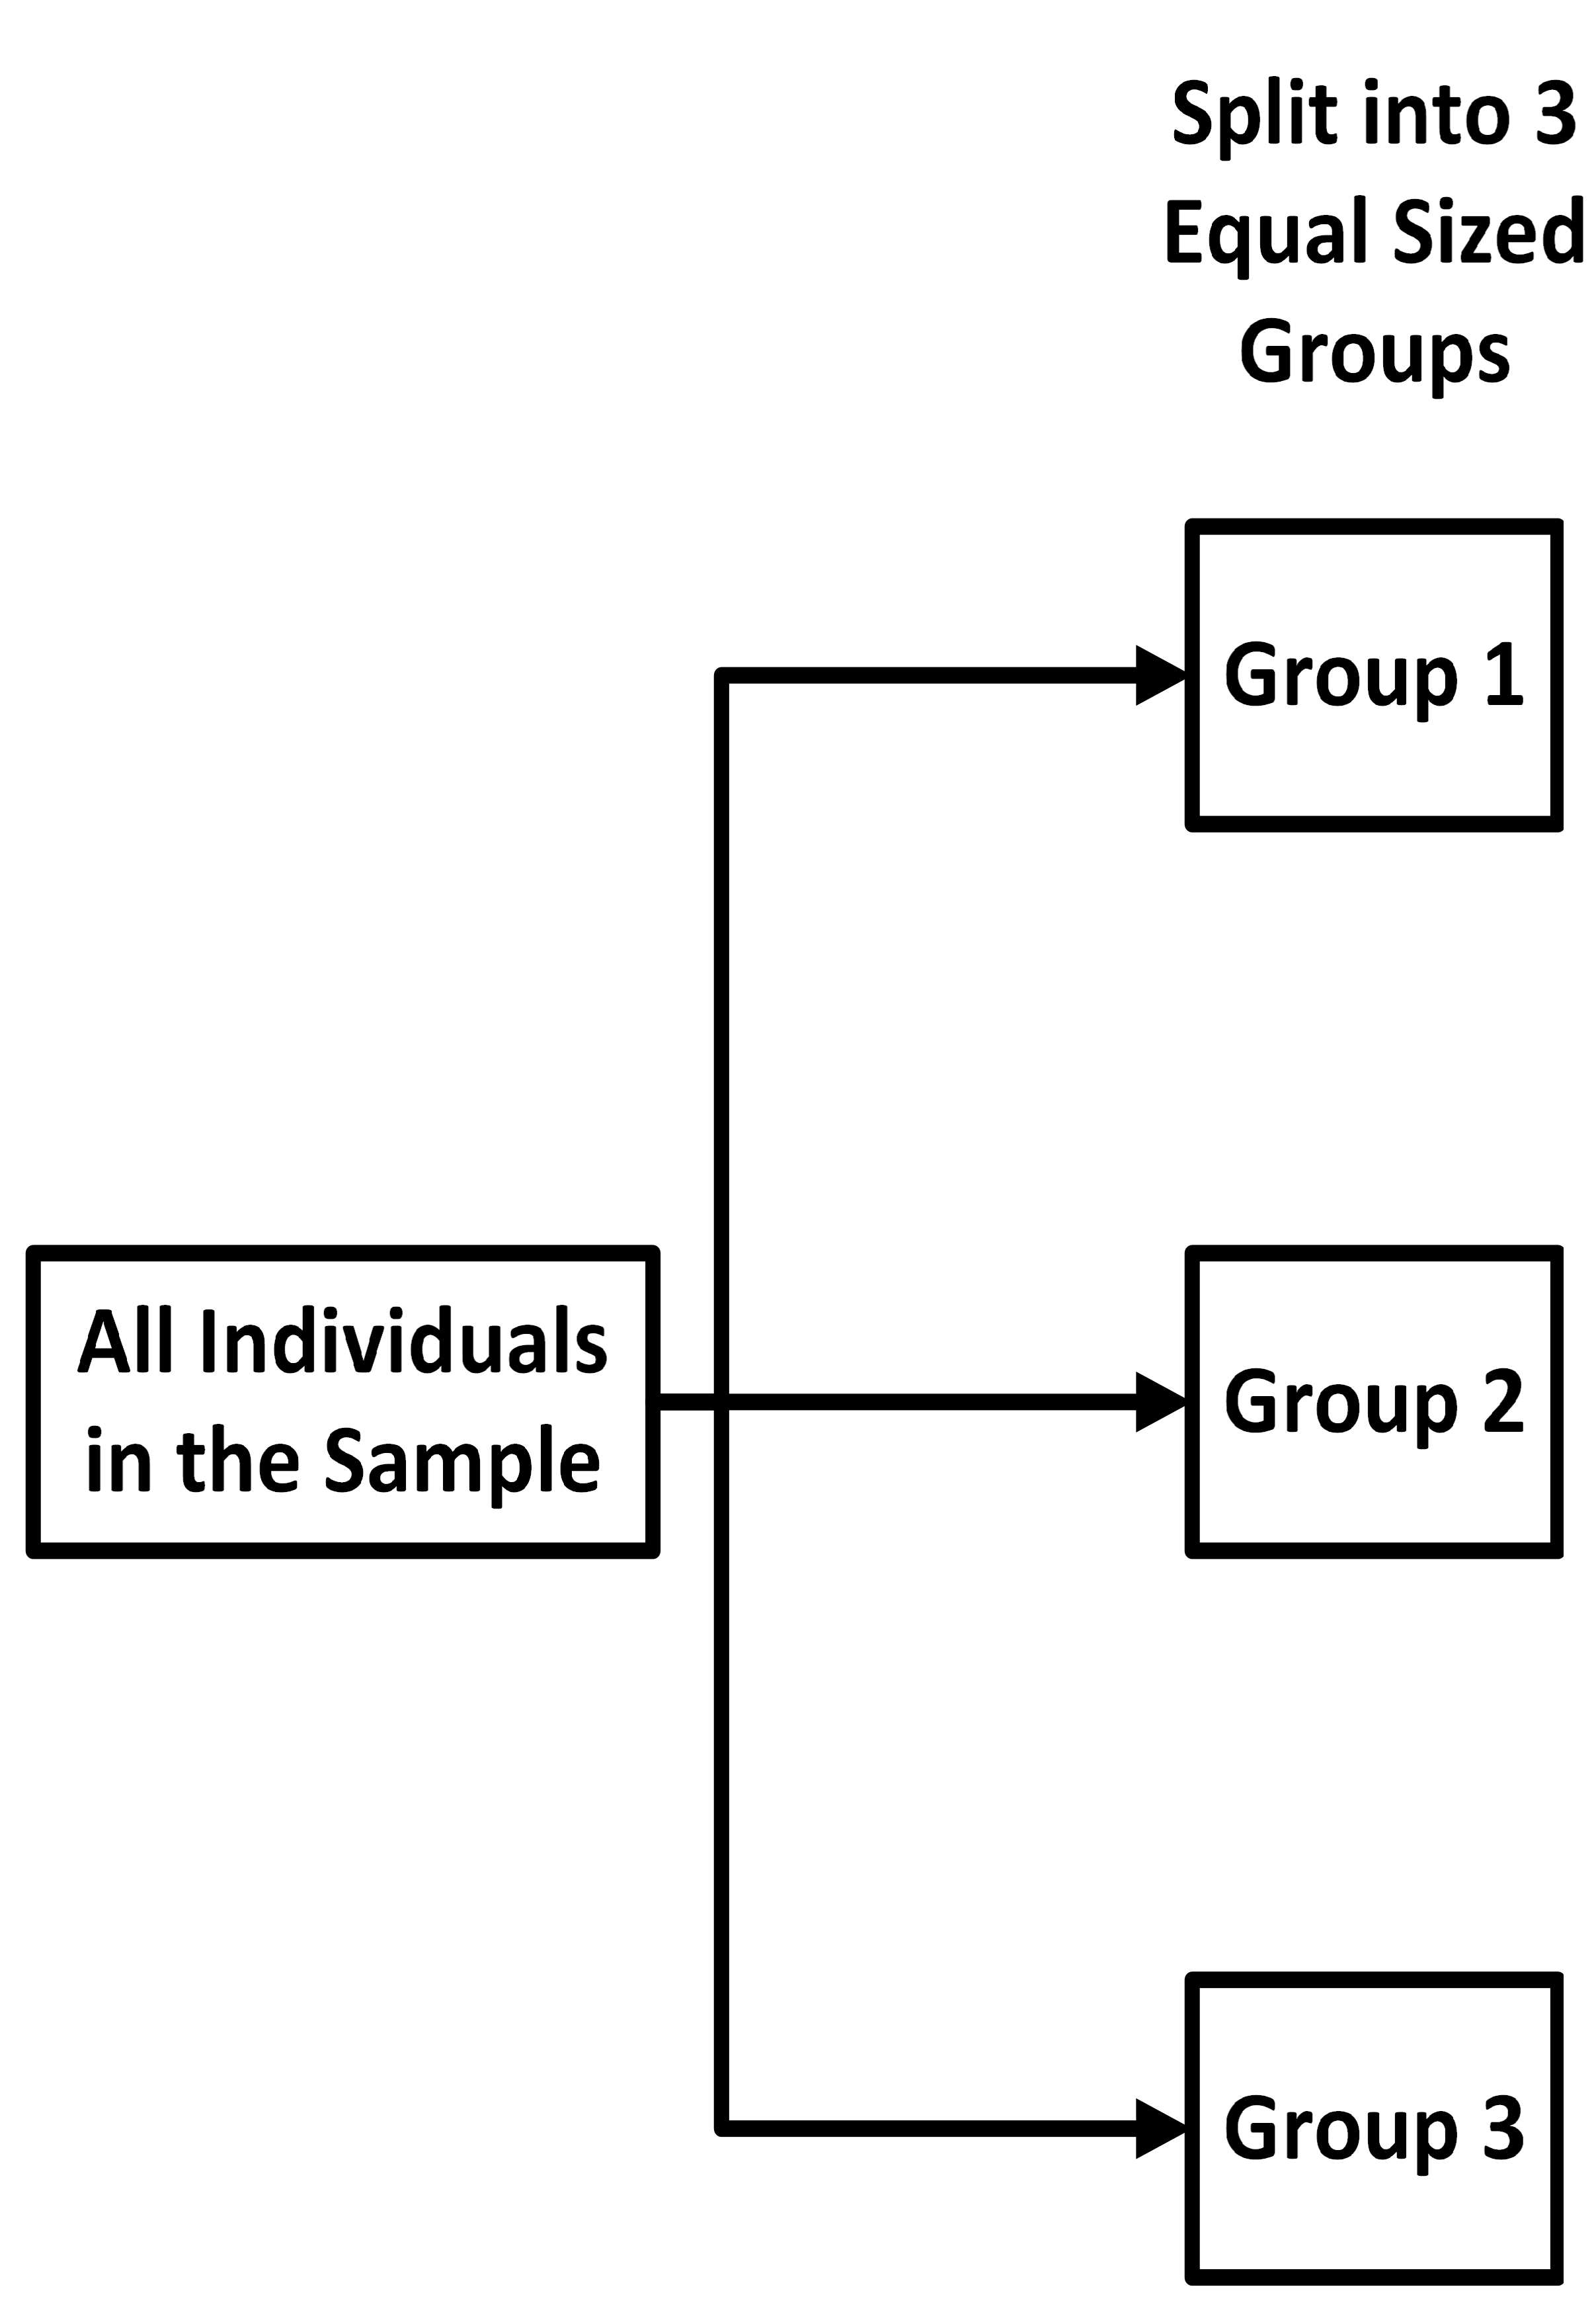
First, we have a block to represent all the individuals in the sample. Next, we
randomly sort the individuals into three groups:
one group for each treatment and one placebo group. We label the groups 1, 2, and 3.
We draw
an arrow from our initial block to each of the three groups, as follows.
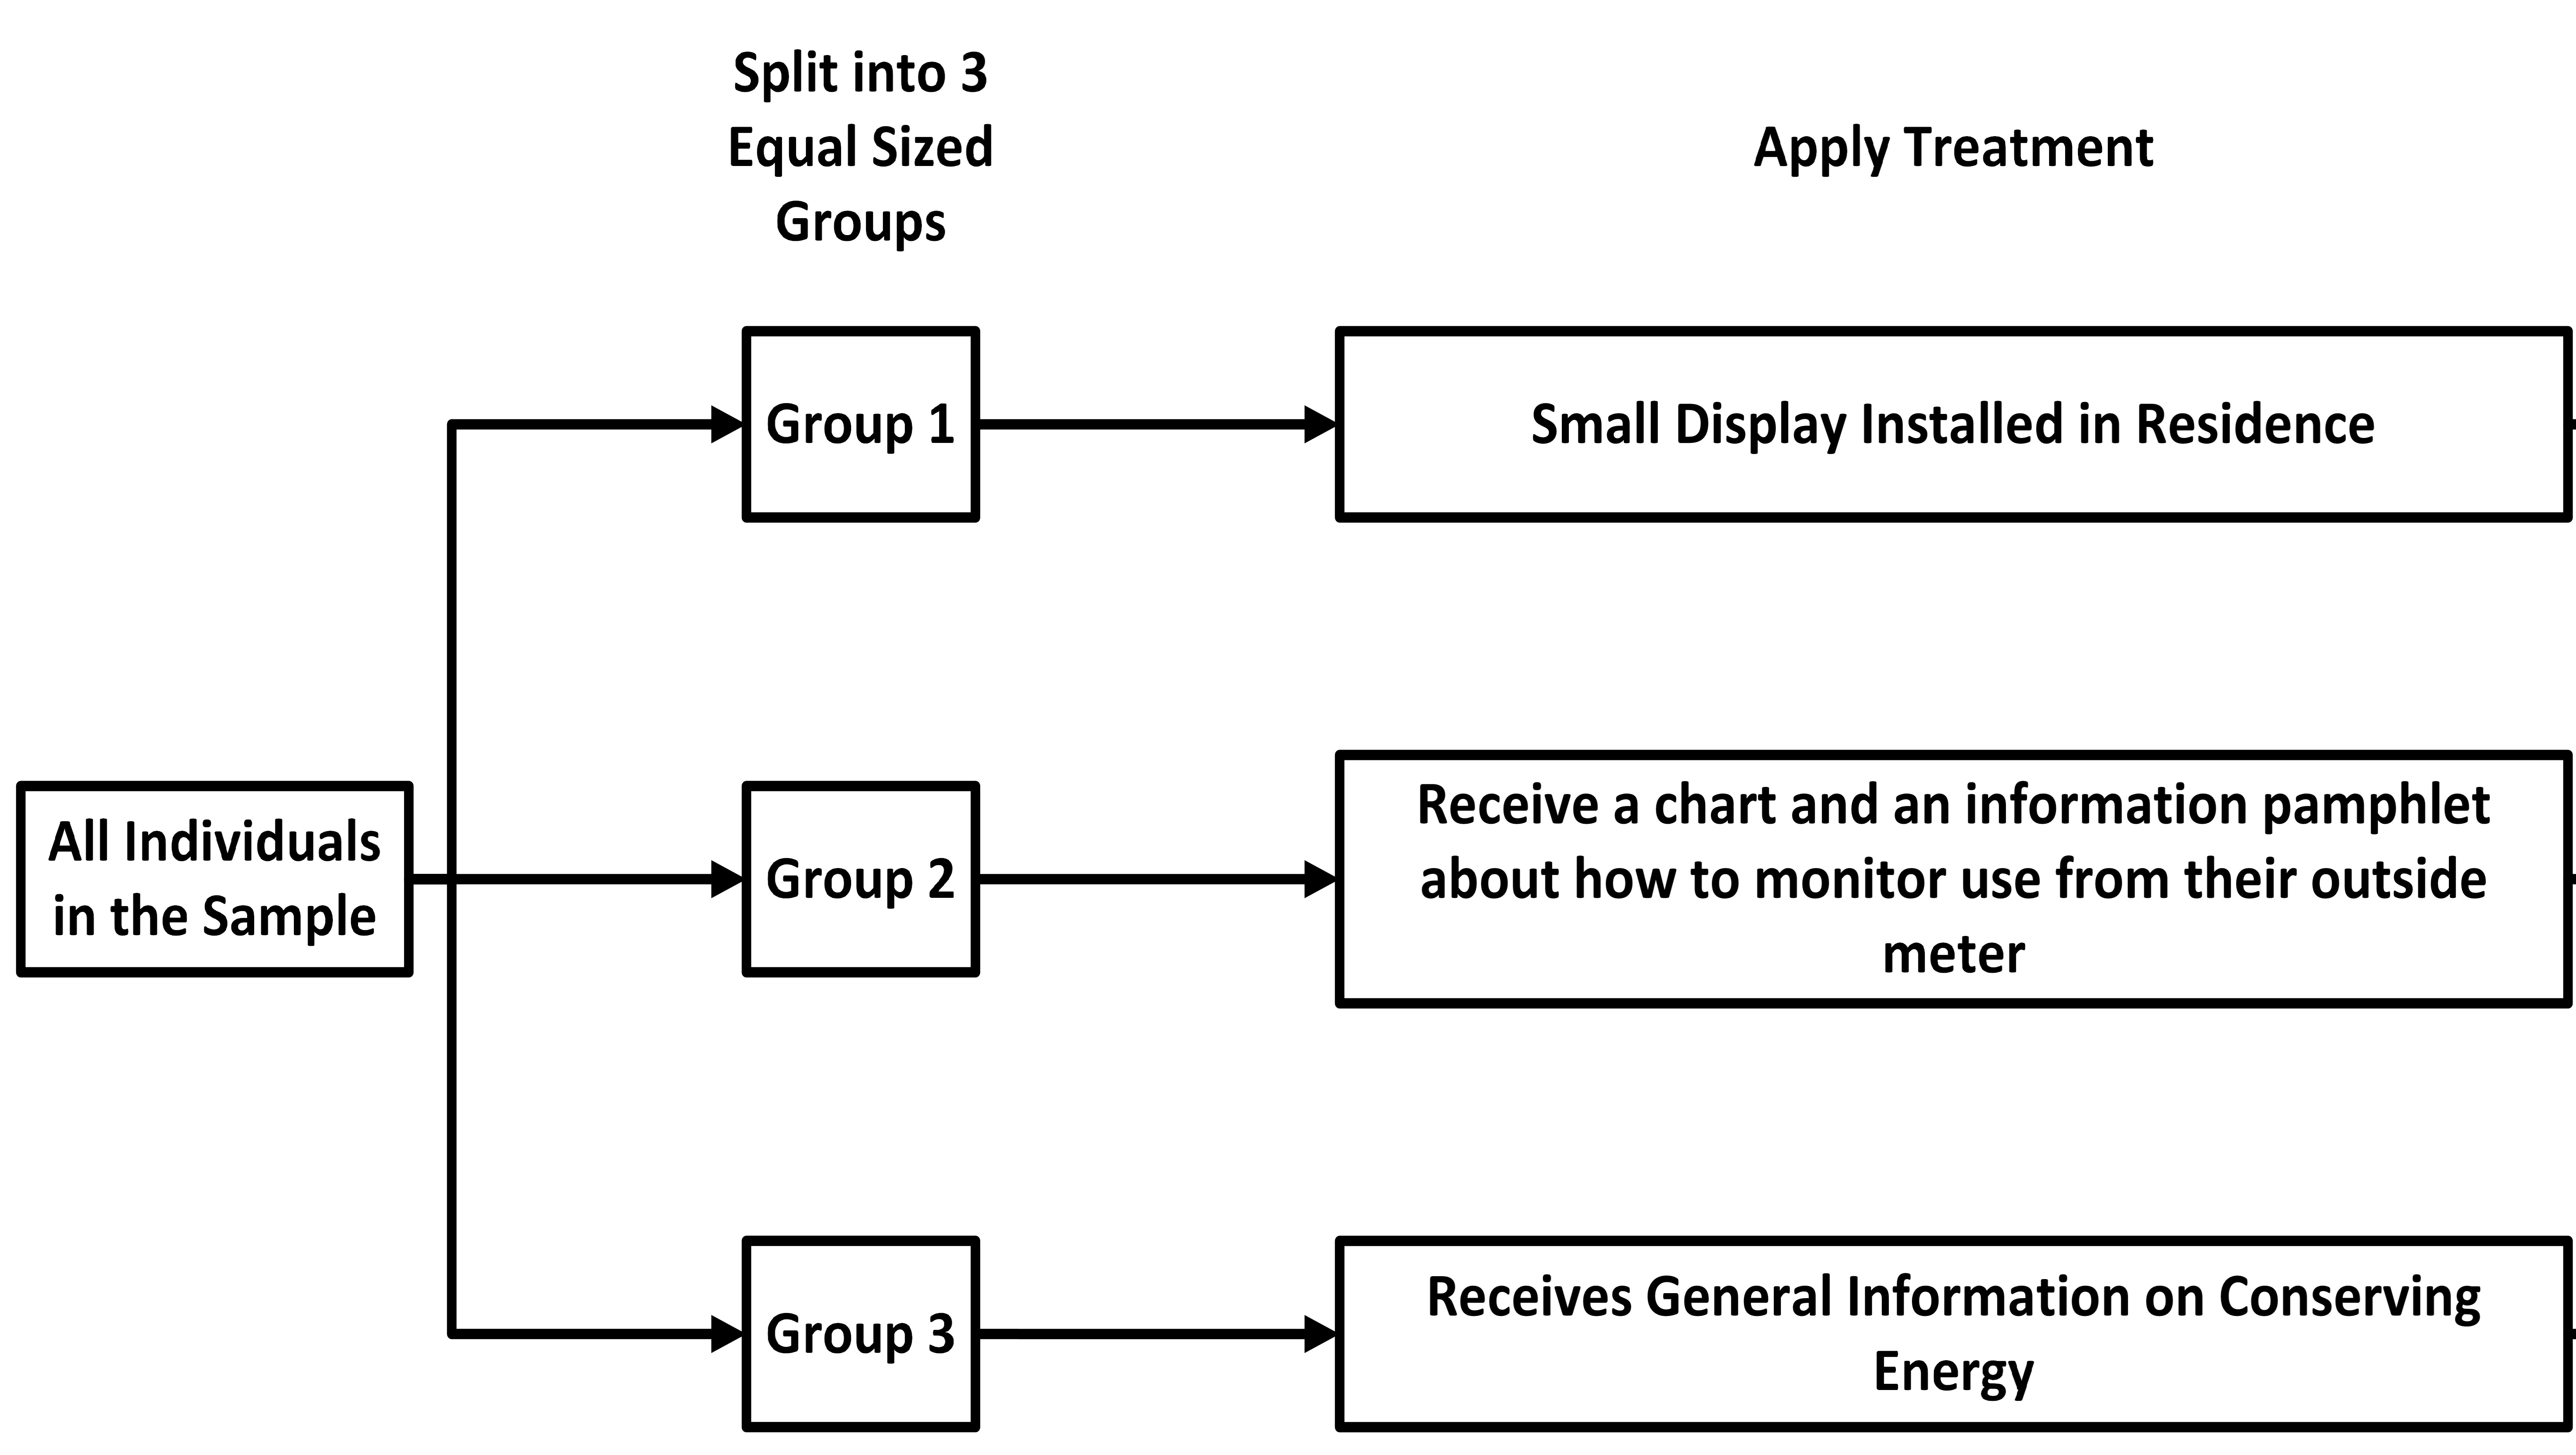
 Next, we add a block for each treatment and one for the
placebo.
We assign the treatments to the groups at random. In the diagram, we then draw
an
arrow from the group to the treatment it receives. Typically, the treatment
block is
draw to the right of the group block it is assigned to, as demonstrated in the
following
image.
Finally, we add a single block at the end indicating that the data is collected, and
the
results from all the treatment and placebo groups should be compared. In the
flow
chart, we indicate this by drawing an arrow from each treatment to the Compare
Results box,
and our flowchart is complete..png)
\[ \tag*{\(\blacksquare\)} \]
What is a Randomized Block Design?
A randomized block design groups subjects into blocks based on shared characteristics or variables that may influence the results. Treatments are then randomly assigned within each block, and comparisons are made within the blocks.
Example: In a weight loss study, participants are grouped into blocks by gender (e.g., male and female). Within each block, participants are randomly assigned to different diet plans, and results are compared separately for males and females.
Example
A cosmetics company wants to compare the effectiveness of two facial creams: Cream A, which claims to reduce wrinkles, and Cream B, which claims to improve skin hydration. The company recruits 40 participants and divides them into blocks based on skin type: oily, dry, combination, and sensitive. Each block contains 10 participants. Within each block, participants are randomly assigned to use either Cream A or Cream B for four weeks, and their skin condition is evaluated at the end of the study.
Design a diagram that models this experiment.
Solution
This experiment uses a randomized block design, and the flowchart can be designed as follows.
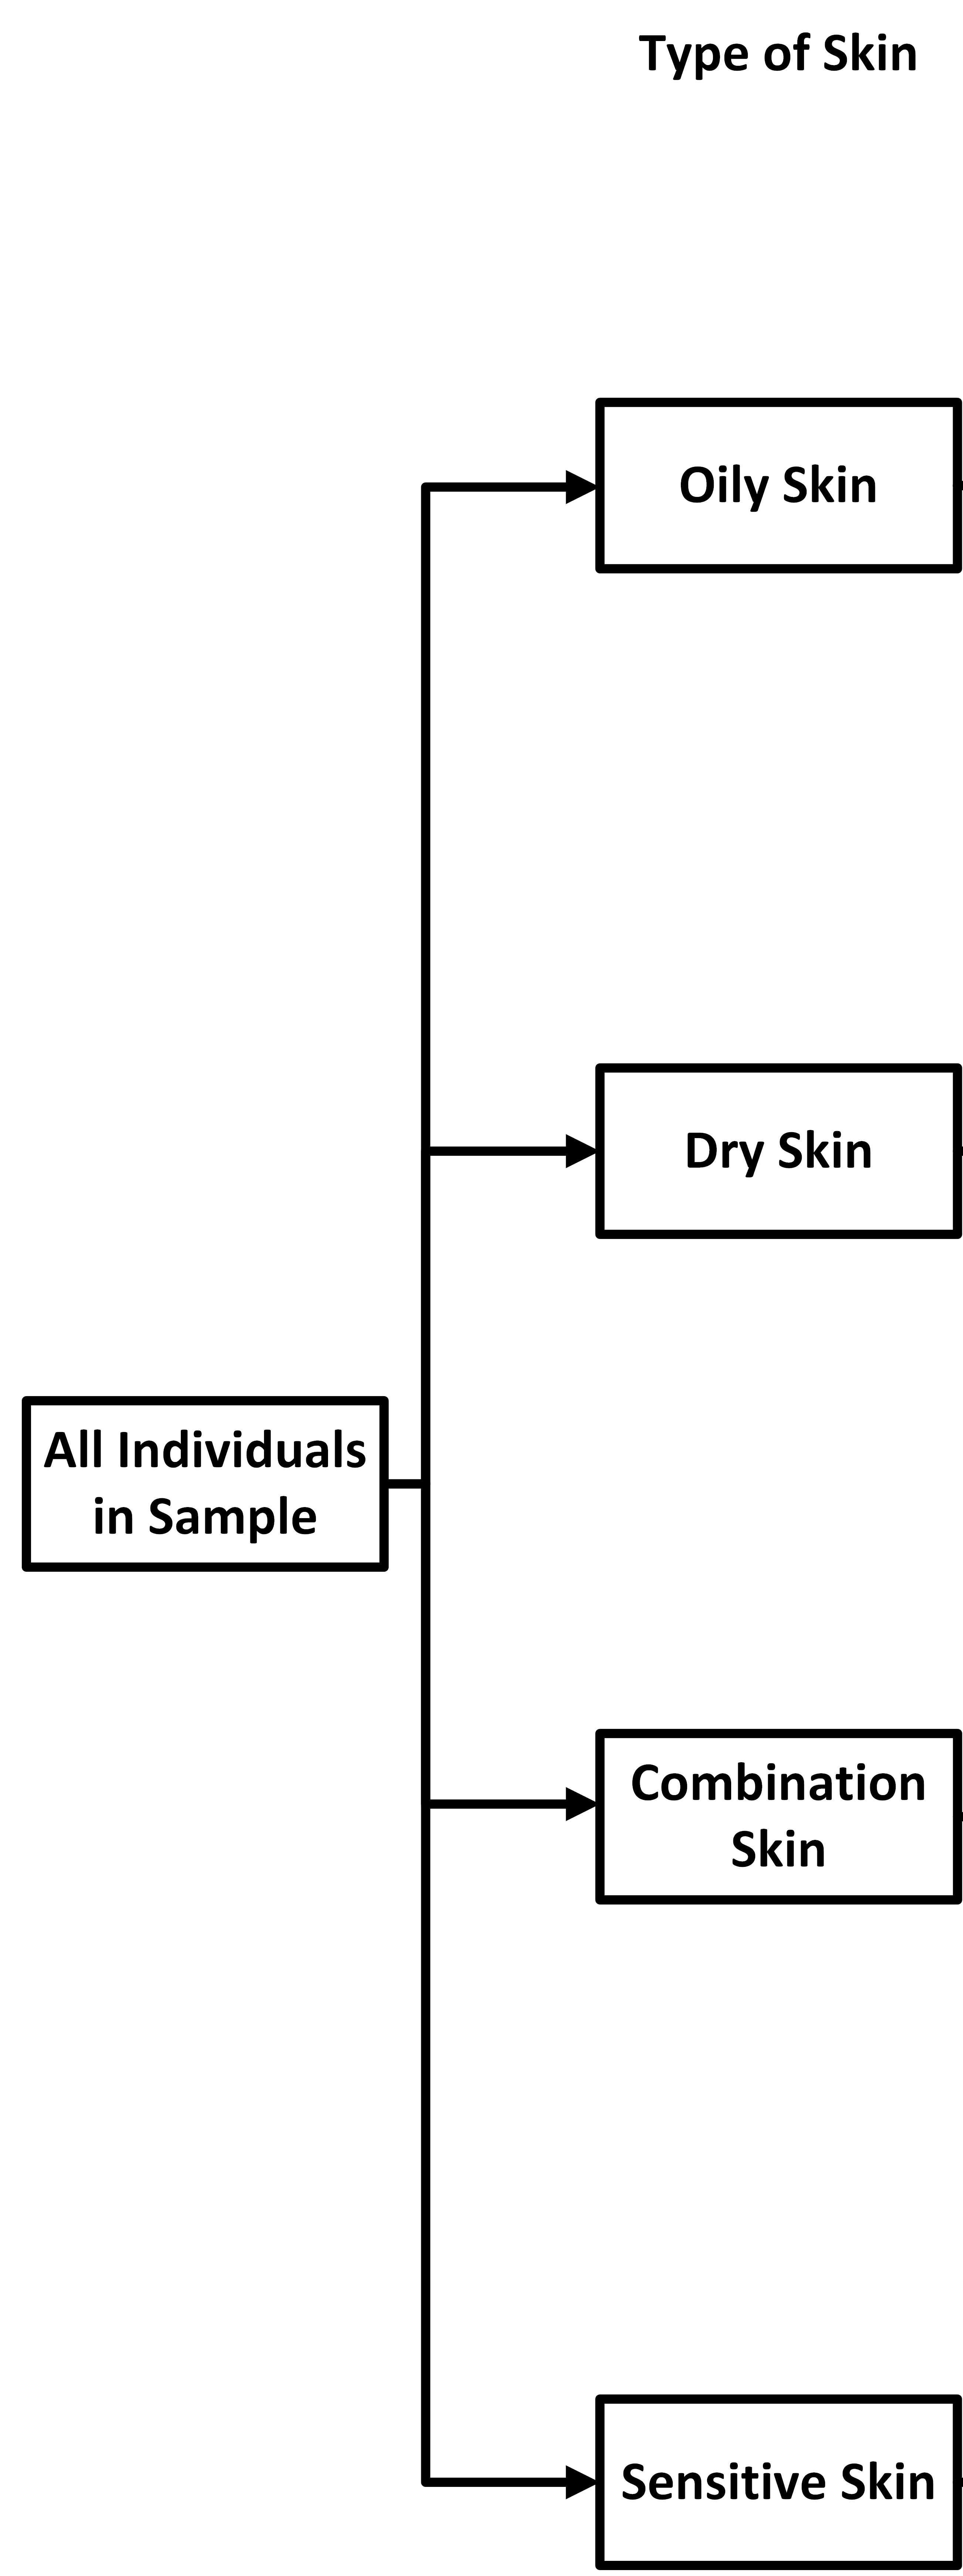
As before, we start with a block to represent all the individuals in the sample.
 Next,
we add in blocks for the different skin types since the creams may affect different
skin
types differently. We draw an arrow from the sample to each of the different skin
types.
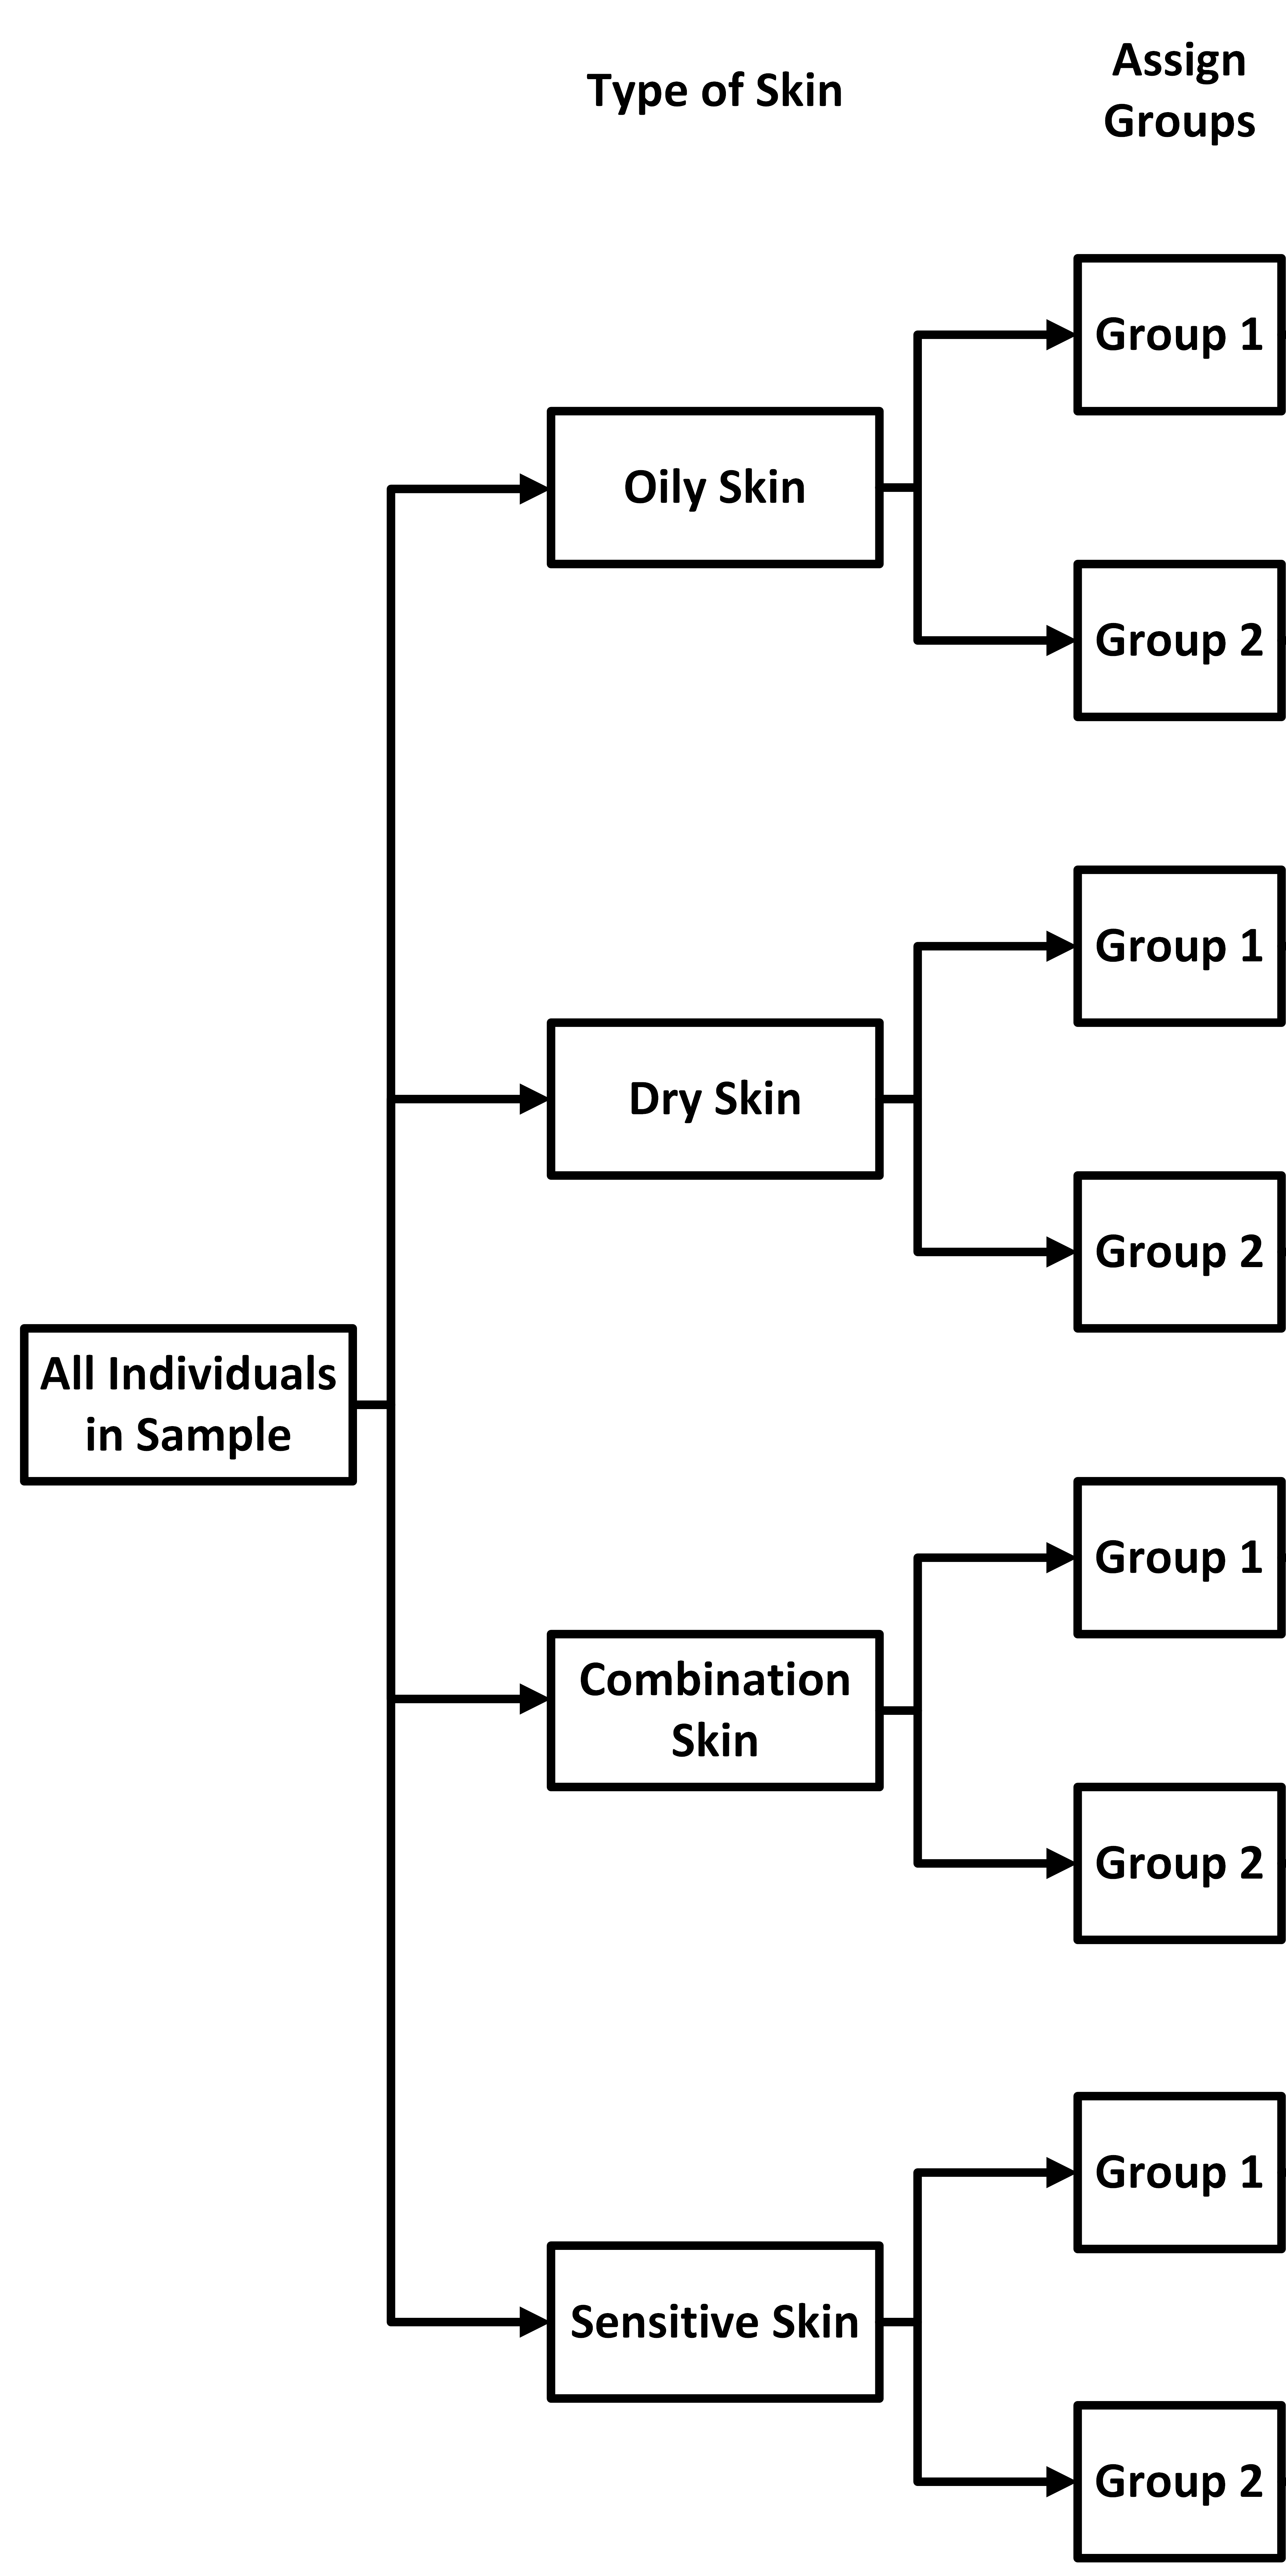
 Now, we
treat each block as its own SRS, and assign members in each block into one of two
groups, as
shown below.
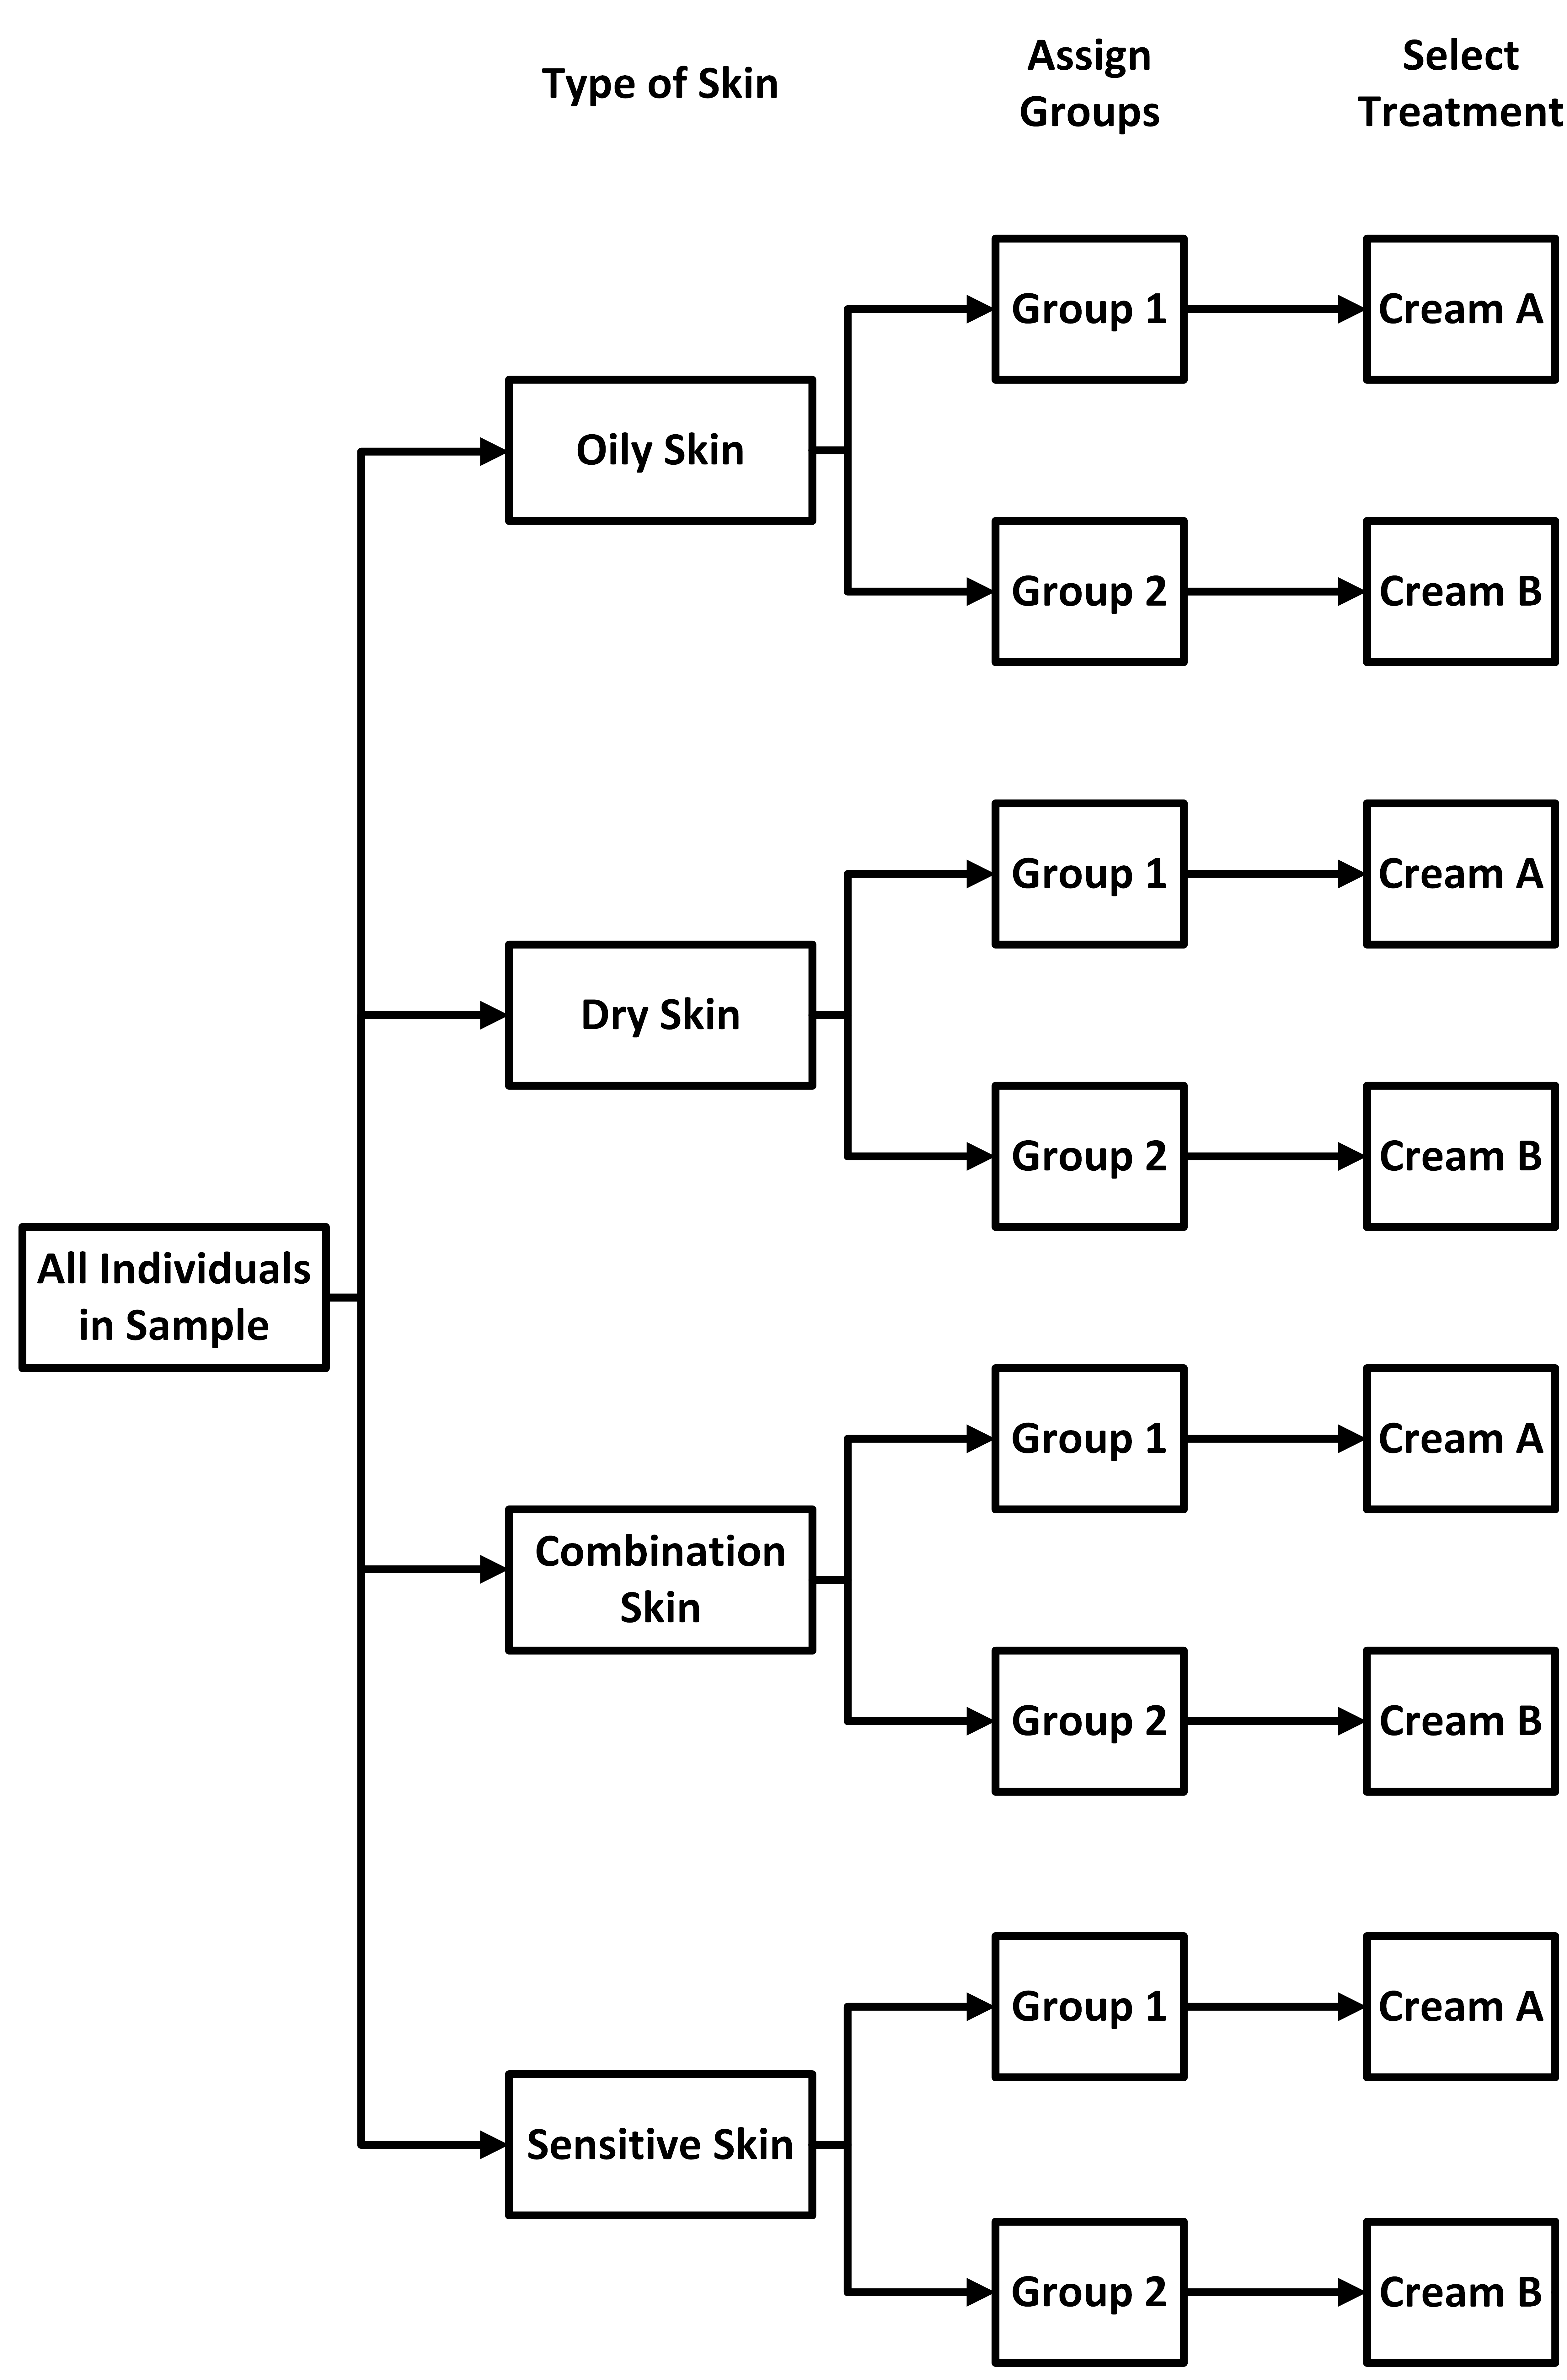
 Since we are treating each block as its own SRS, we'll
assign each group within a block one of the two creams.
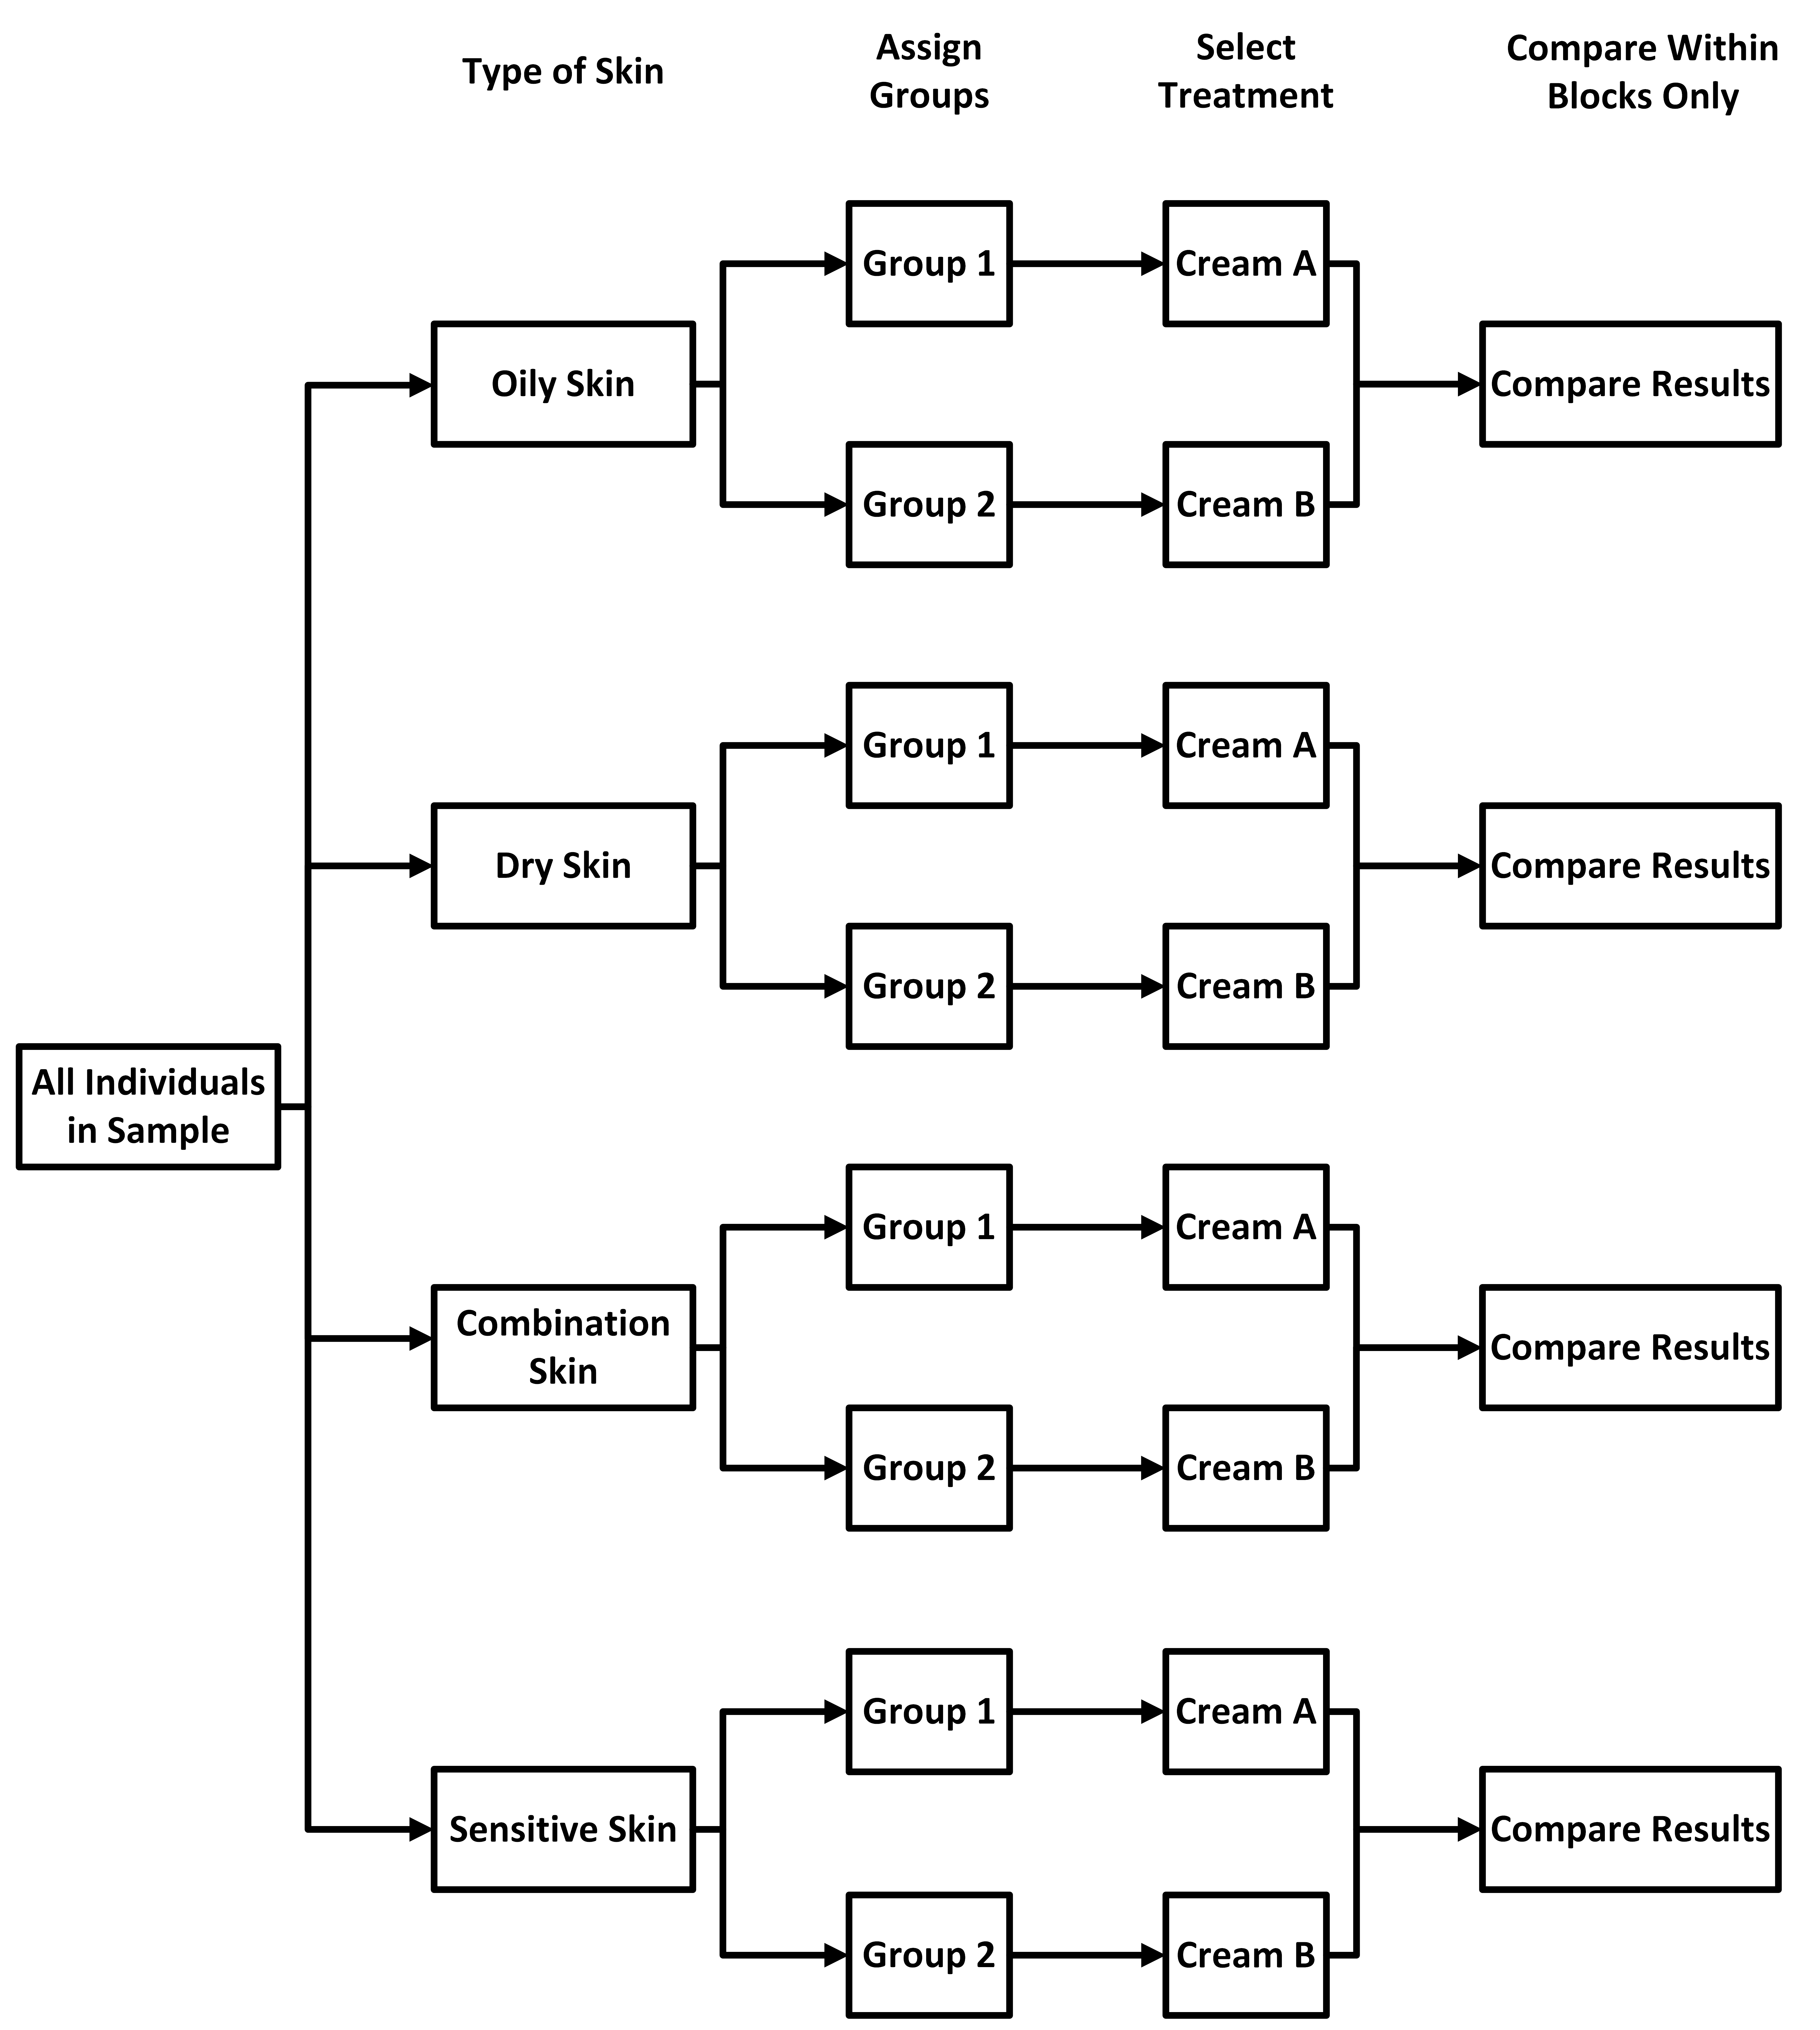
 The whole point of the block design is to
account for
the different types of skin. So, when we get to the compare results step, we only
compare
results within each block. This ensures that any differences observed are due
to the
treatment and not the characteristics defining the blocks.
The final flowchart shown below.
\[ \tag*{\(\blacksquare\)} \]
What is a Matched Pairs Design?
A matched pairs design is a special case of the randomized block design where subjects are paired or matched in some way. This design is used to compare two treatments.
- Version 1: Pair two individuals based on shared characteristics.
Randomly assign one individual in each pair to receive the first treatment, and the
other to receive the second treatment. Compare results within each pair.
Example: Two participants of similar age and fitness level are paired. One is assigned to a new exercise routine, and the other follows a standard routine. Their progress is compared after four weeks.
- Version 2: Use the same individual for both treatments. Assign one of
the treatments to the individual at random, and once the experiment is concluded, apply
the other treatment at a later time under similar conditions. Compare the results for
that individual.
Example: A participant tests two different types of running shoes by running a set distance with each pair on different days. Their times are compared to determine which shoe performs better.
Example
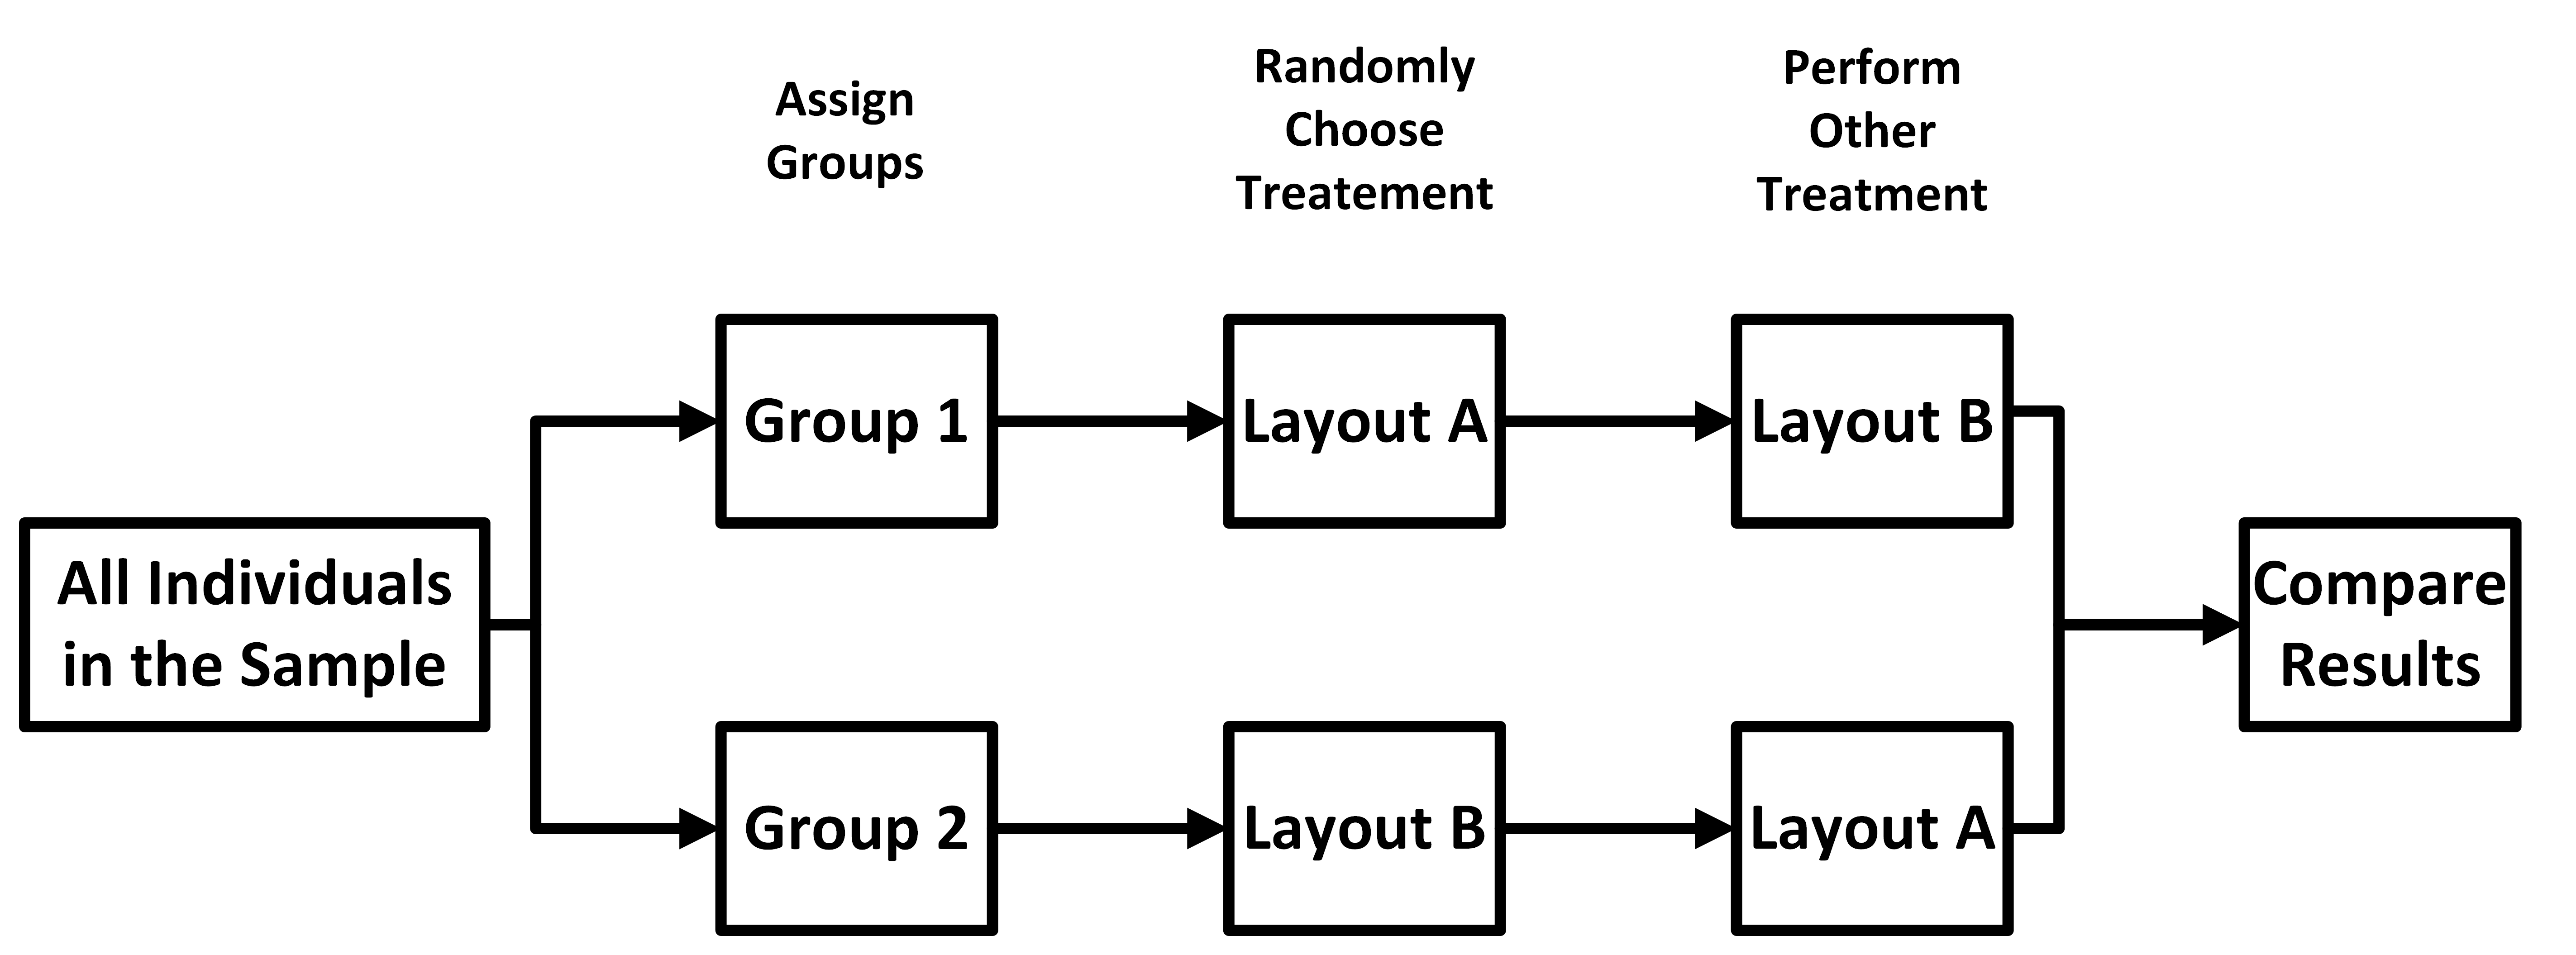
Researchers are studying the effect of two different dashboard layouts on driver reaction times during sudden stops. The two layouts are:
- Layout A: A traditional dashboard with analog gauges.
- Layout B: A modern digital dashboard with heads-up display features.
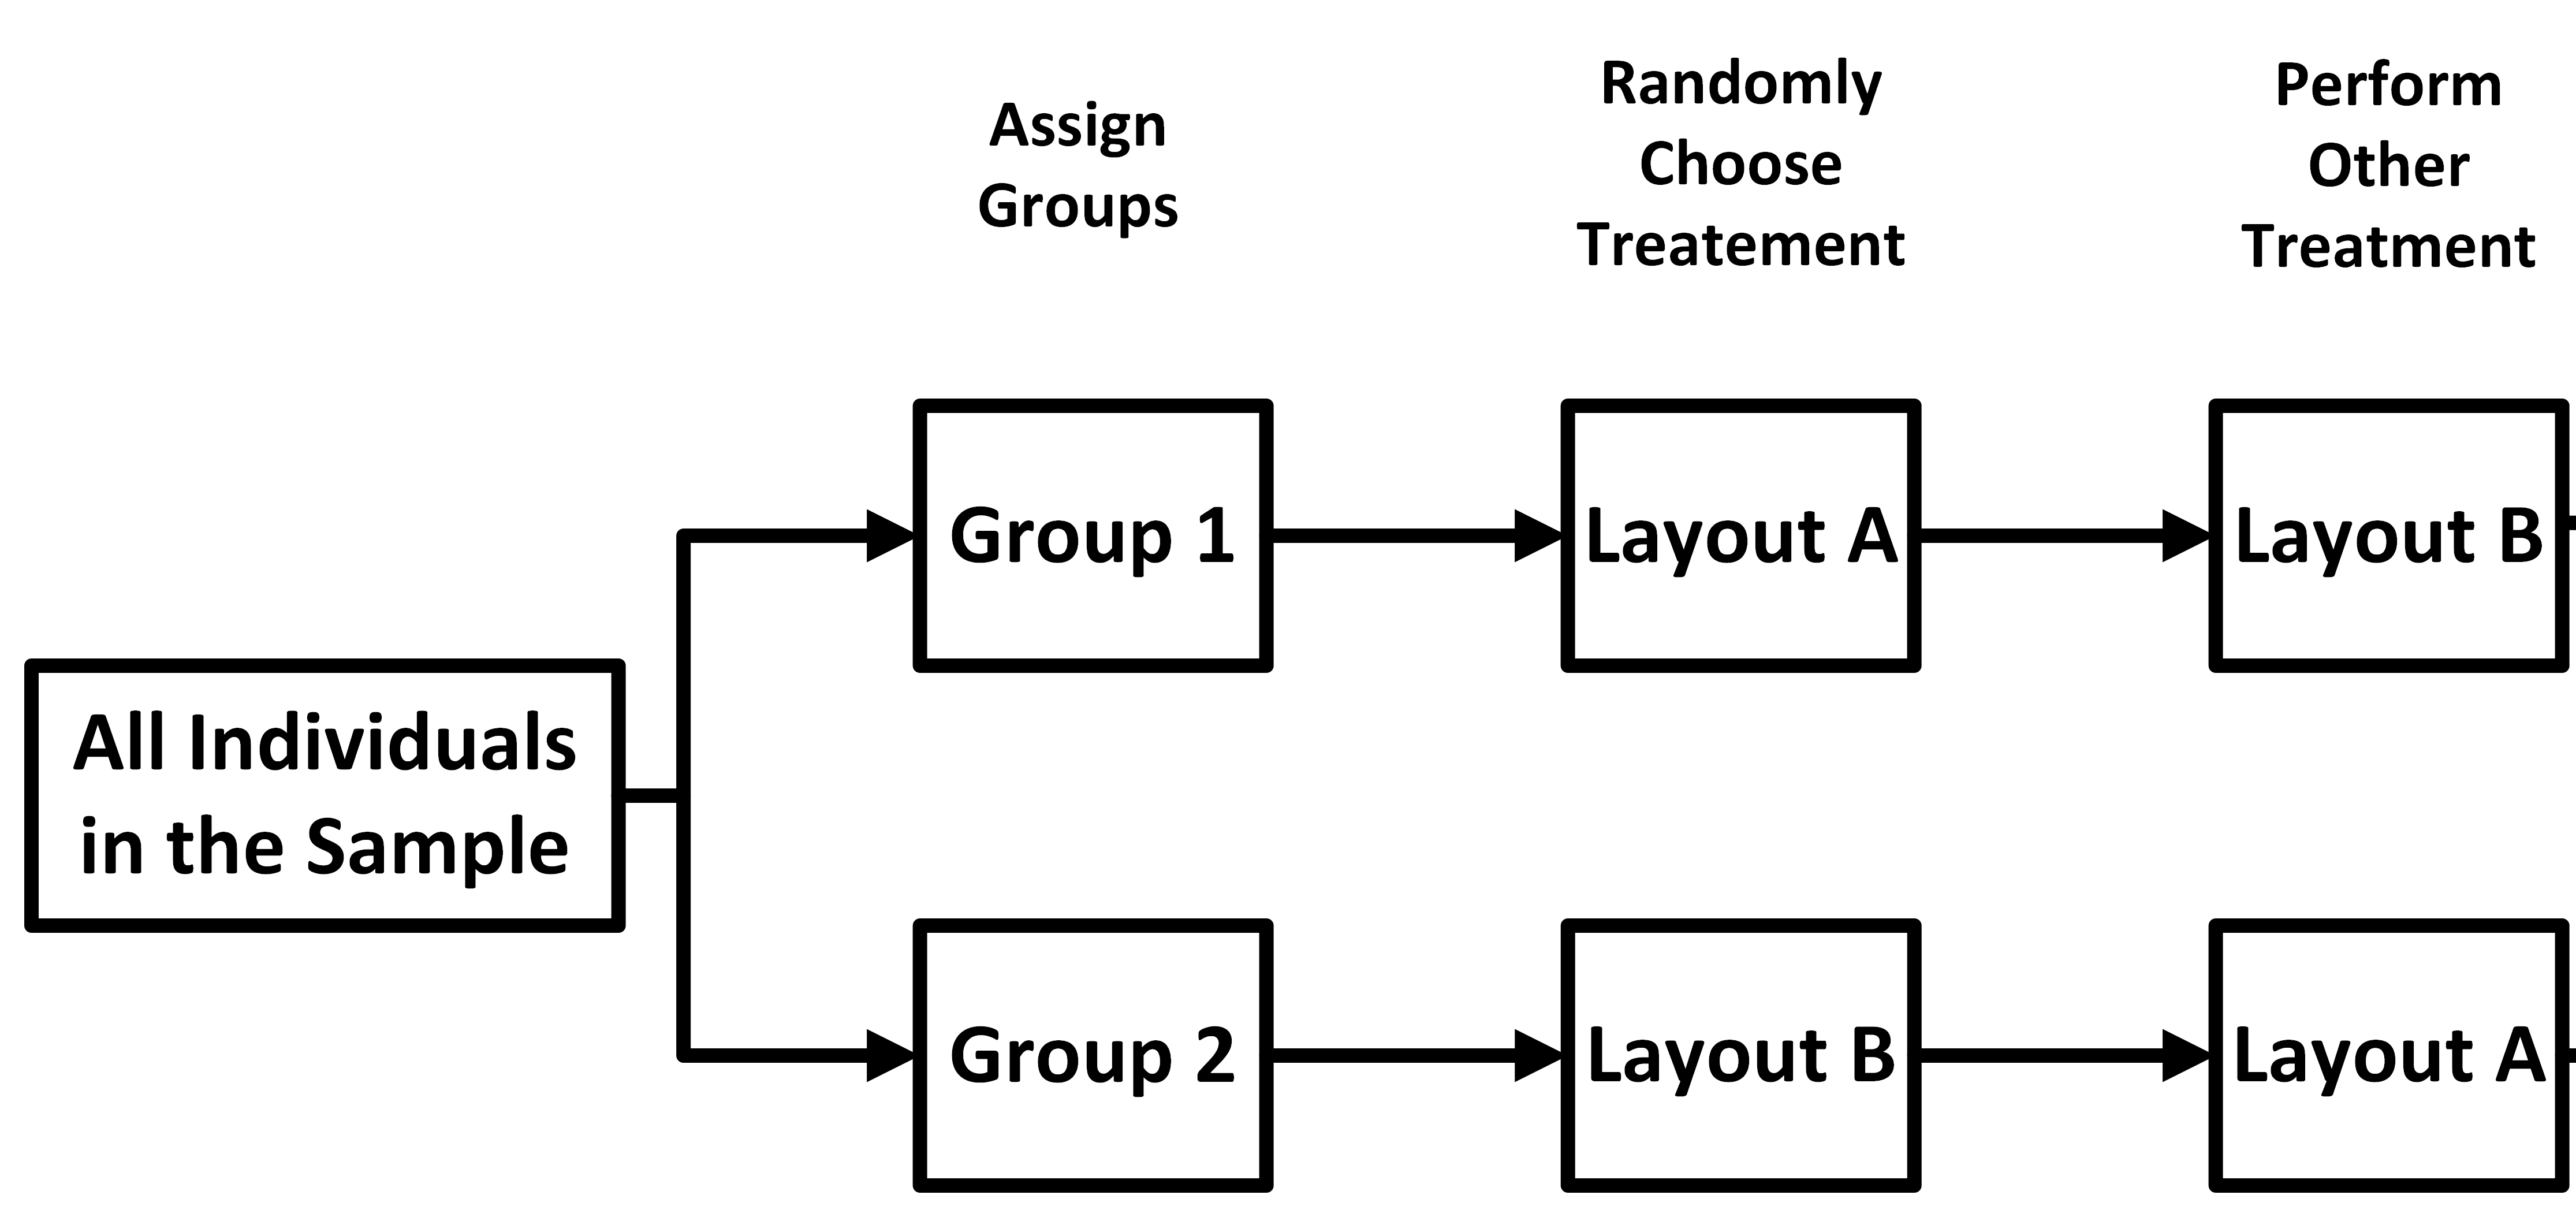
Each participant is randomly assigned to use one dashboard layout while completing a driving simulation. After a break, the same participants repeat the simulation with the other dashboard layout under similar conditions. Reaction times are measured during each simulation.
Describe and diagram a matched pairs experiment to determine if the modern dashboard increases safety.
Solution
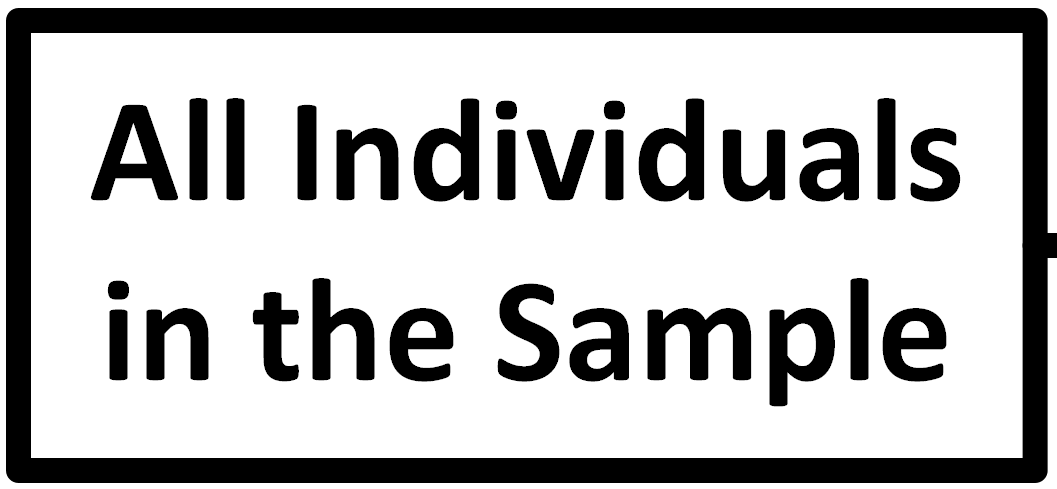
This is a matched-pairs design (Version 2) because each participant serves as their own control by testing both dashboard layouts. As before, we start off with the random sample.
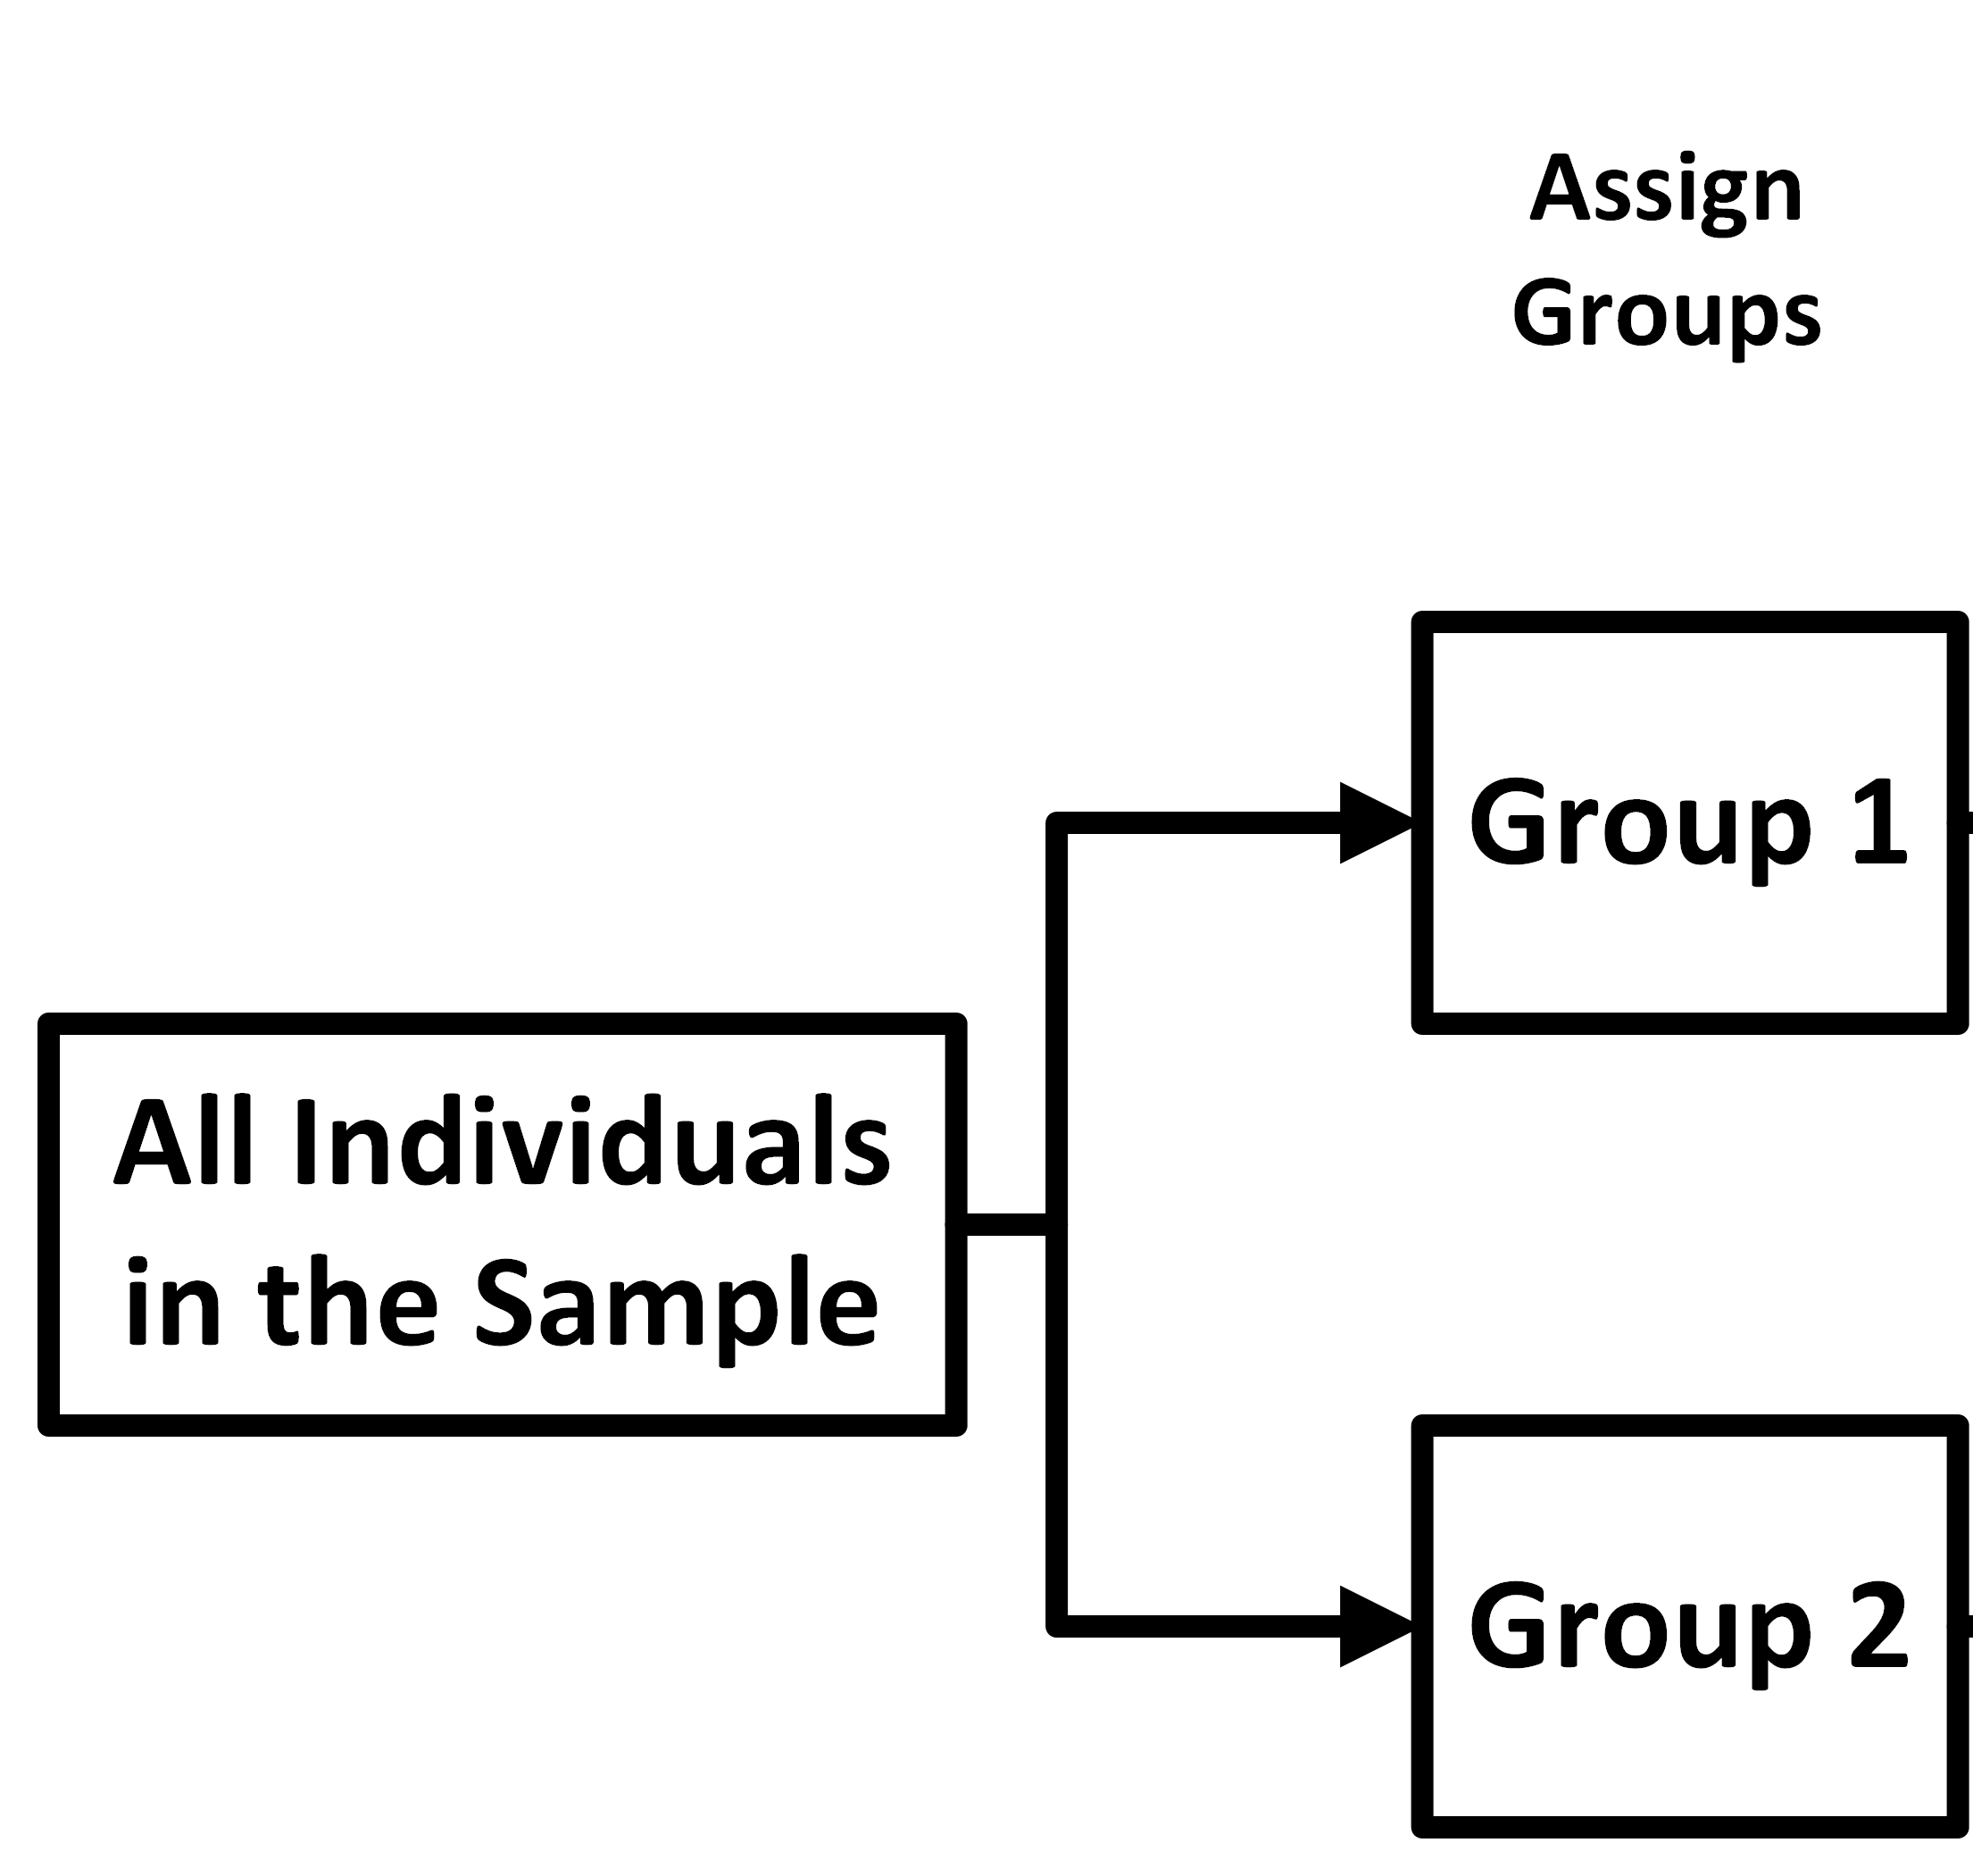
 Next, assign the participants into one of two
groups.
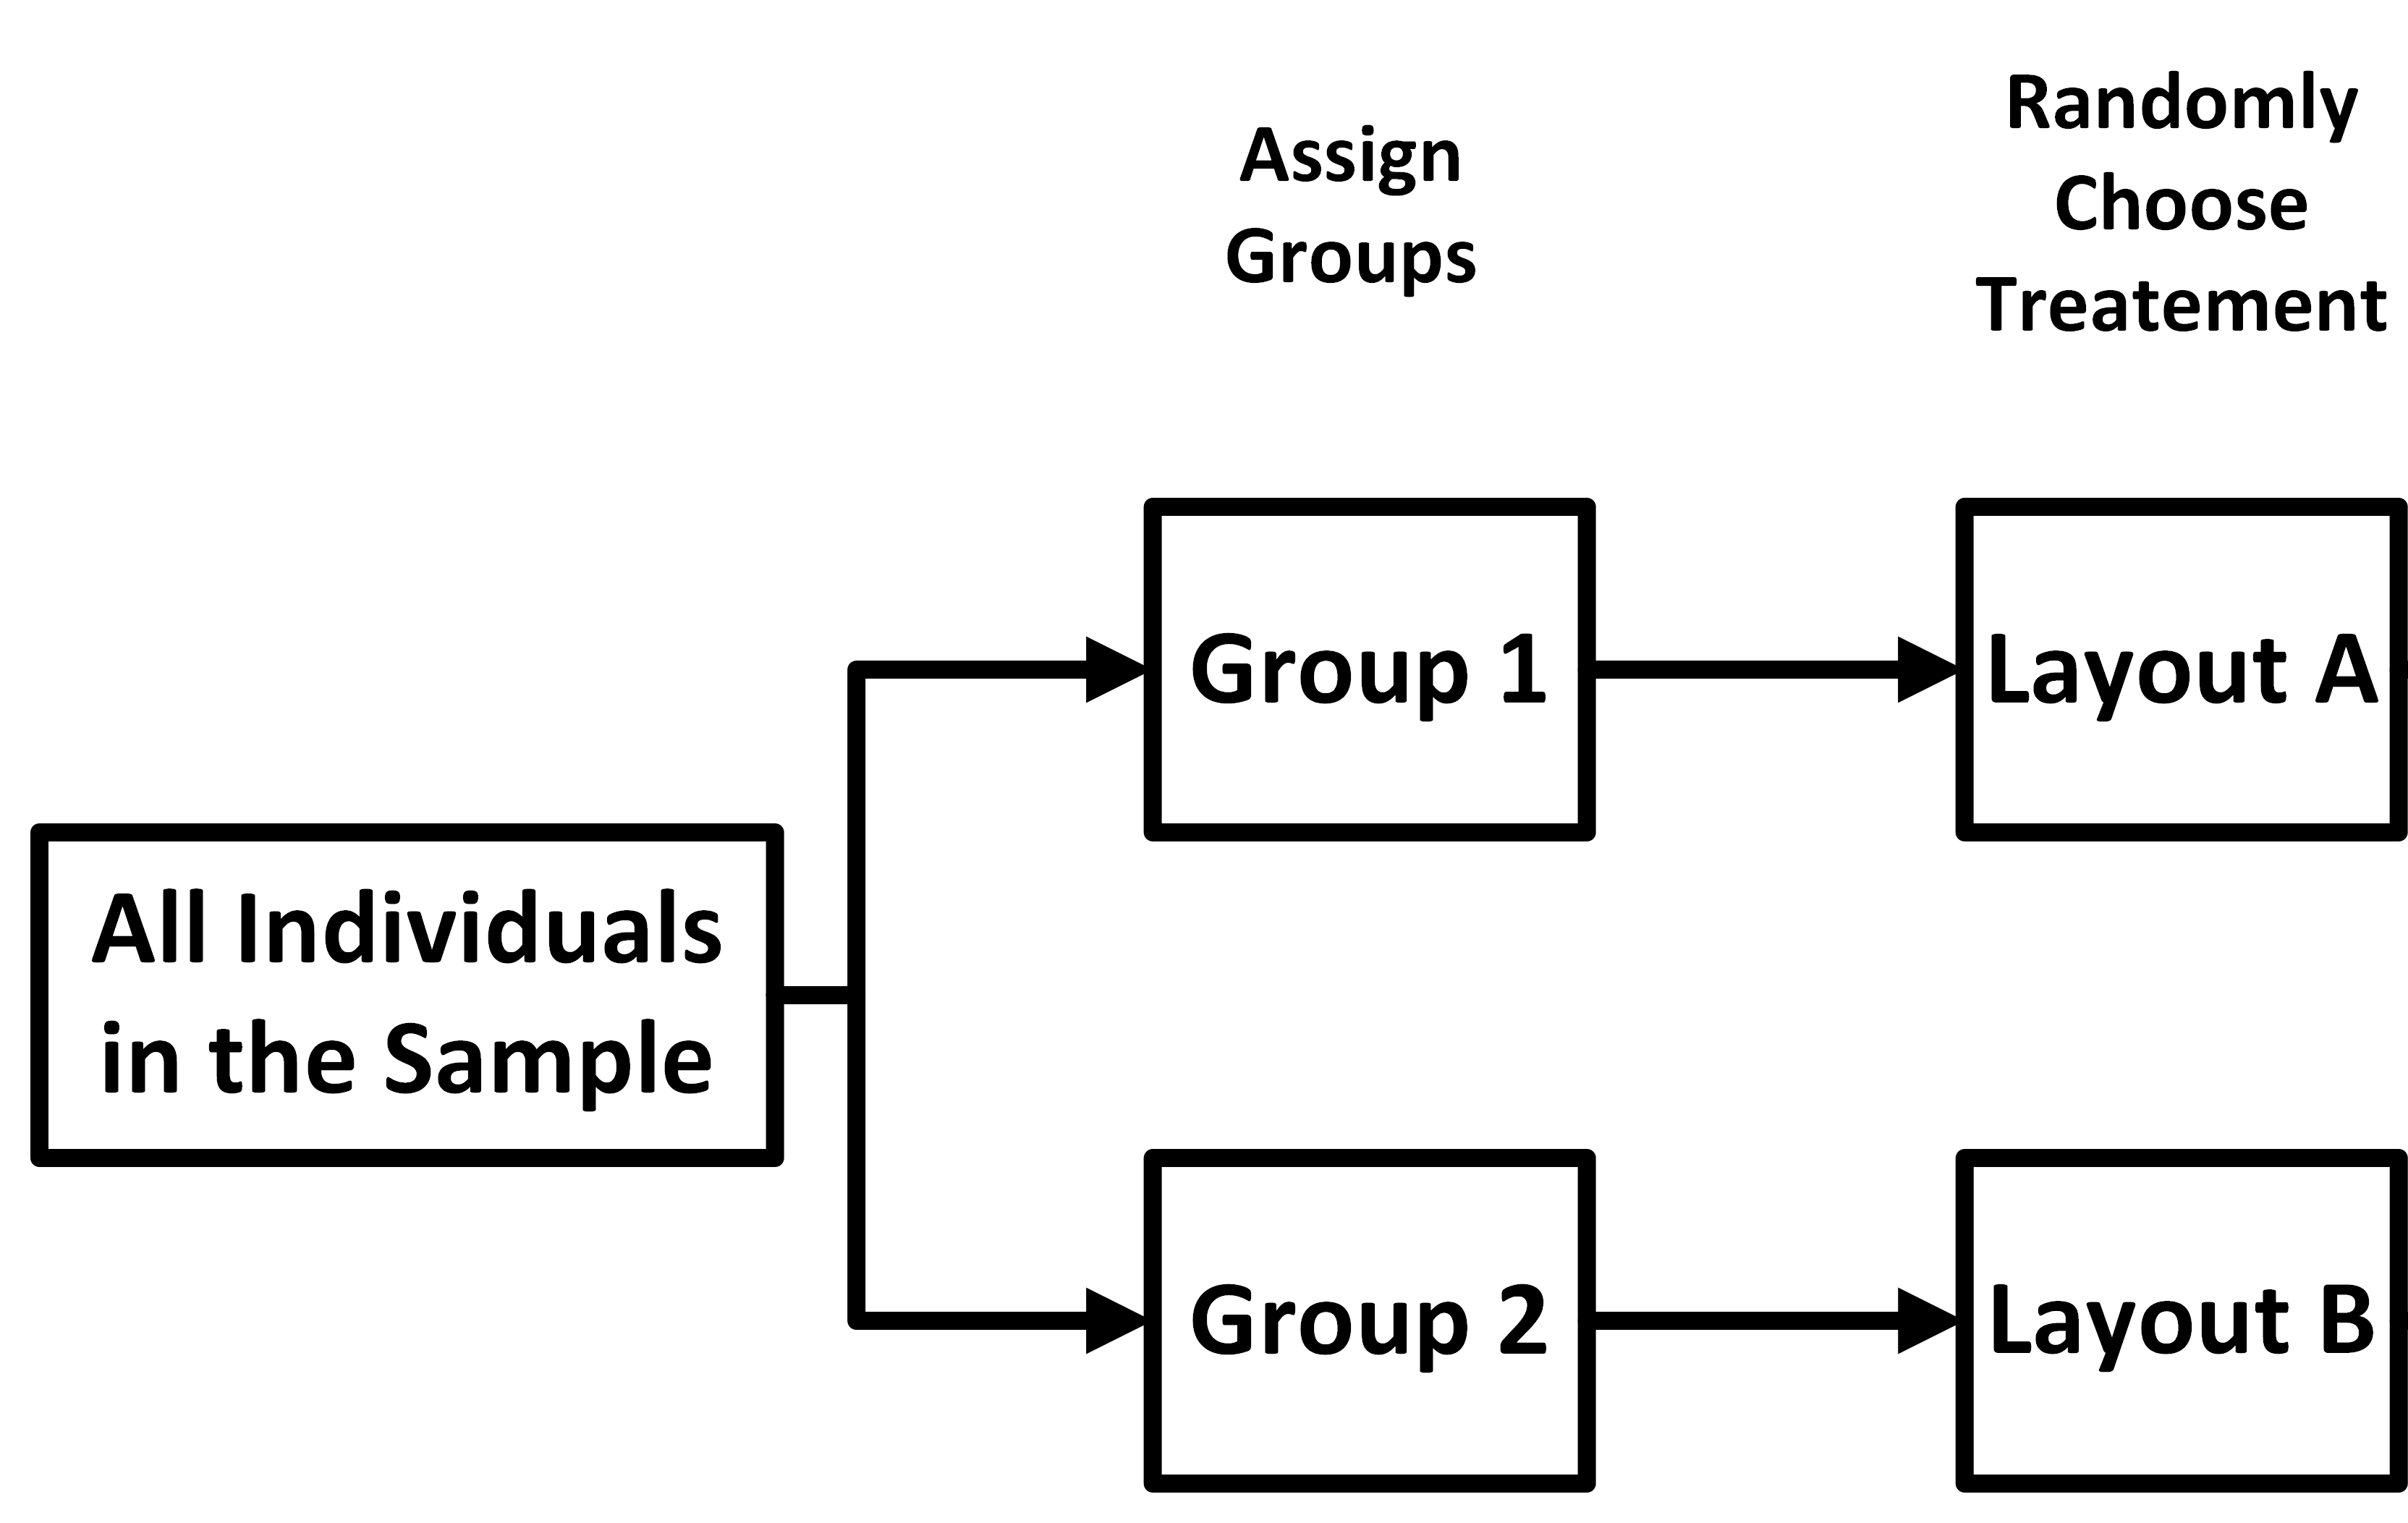
 Next, randomly assign one of the two treatments to each
group.
 After a period of time has passed and under similar
conditions, the
groups are given the other treatment.
 Finally, you compute the difference in results
between
the two treatments, and compare all the differences among the participants.
\[ \tag*{\(\blacksquare\)} \]
Conclusion
Good experimental design minimizes bias, controls variability, and ensures valid comparisons. Completely randomized designs work for homogeneous groups, randomized block designs account for shared characteristics, and matched pairs designs allow detailed within-subject or paired comparisons. Proper design leads to meaningful and reliable results.